Monitoring network traffic is very important and helpful to understand the problems within the IT environment. Network performance is critical for many businesses if it fails there will be adverse effects that can cost time, money, and resources.
There are various ways to monitor network traffic and performance on a Linux system. Few of them are command-line tools and others are GUI-based.
So in this article, we will discuss how to monitor network traffic in Linux using command line or GUI tools.
Command-line tools to monitor network traffic
There are many tools available for monitoring network traffic in a Linux system a few of them are given below.
iftop
The iftop is a free command-line tool to monitor the network on a system. It displays an updated list of network connections these connections are ordered by bandwidth usage.
iftop captures packets that moving in and out from the network adapters and sums up to find the bandwidth being utilized by our servers.
To install it on Debian/Ubuntu use –
sudo apt install iftop -y
On RHEL/CentOS use –
sudo yum install iftop -y
Once it gets installed use the given command to run this utility and see the bandwidth usage.
sudo iftop
You will see the output something like the given in the image.

By default, iftop will look up the hostnames associated with the addresses it finds in the packets.
Nload
This command allows users to monitor incoming and outgoing traffic separately. It also displays a graph that can be helpful in a quick overview of the traffic.
To install it on Debian/Ubuntu use –
sudo apt install nload -y
On RHEL/CentOS use –
sudo yum install nload -y
Once it gets installed use the given command to run this utility and see the bandwidth usage.
sudo nload
Now this will display output something like the given in the image.

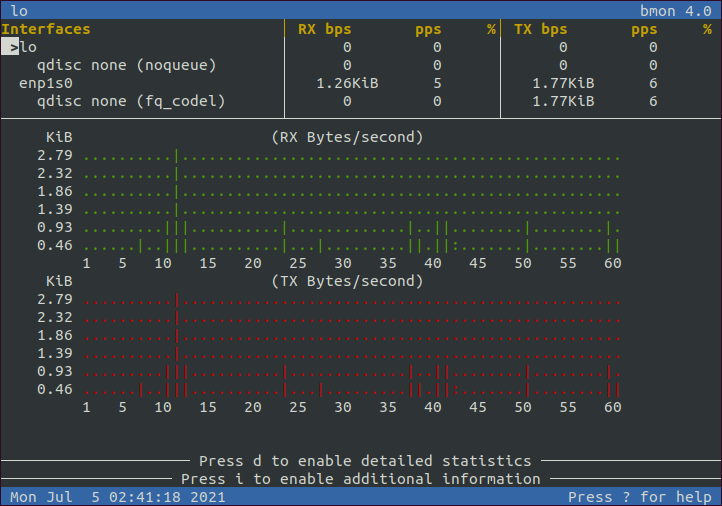
bmon – bandwidth monitor
The bmon or bandwidth monitor is a network monitoring tool that is similar to Nload it shows traffic loads on all the interfaces of a system. It also displays the graph and a section for packet-level information.
Now to install this tool on Debian/Ubuntu use –
sudo apt install bmon -y
If you are using RHEL/ CentOS –
sudo yum install epel-release
sudo yum install bmon -y
Now use the given command to start this tool –
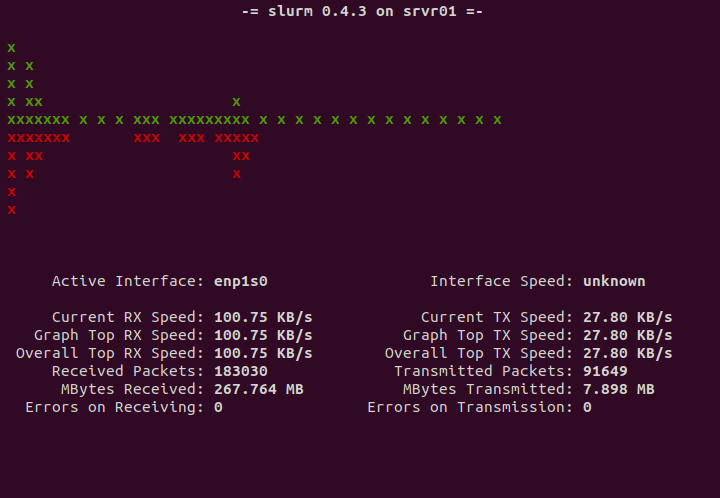
Slurm
The slurm is a system workload manager, we can use it to monitor network traffic on a system. It shows device statics with an ASCII graph. It supports three types of graphs which can be activated using the c, s, and i keys.
To install it on Debian/Ubuntu use –
sudo apt install slurm -y
On RHEL/CentOS use –
sudo yum install slurm -y
After the installation use –
sudo slurm -s -i enp1s0
This will display the output something like given in the image below.
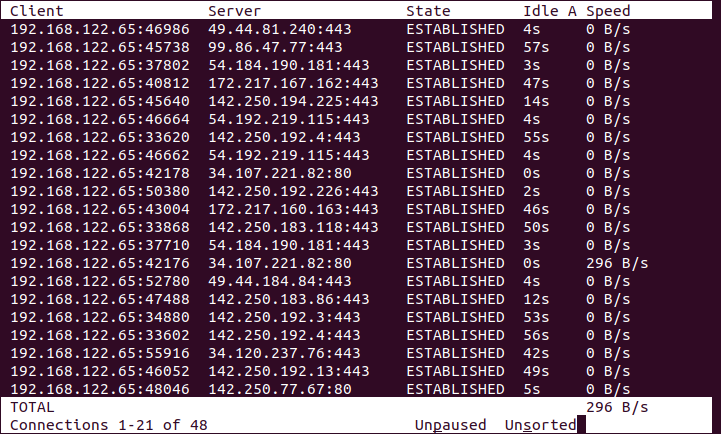
tcptrack
The tcptrack command is quite similar to iftop command. It captures packets and calculates network bandwidth for each TCP connection, it uses pcap library to do so.
Now you can use one of the given commands to install it on your system –
On Debian/ Ubuntu use –
sudo apt install tcptrack -y
If you are using RHEL/CentOS then use –
sudo yum install tcptrack -y
Once it gets install use the given command to start this tool and network monitoring on your system.
sudo tcptrack -i enp1s0
Where enp1s0 is the name of the interface.
vnStat
The vnStat is an open-source command-line network traffic monitor tool for Linux and BSD that keeps a log of network traffic for the selected interface(s). This tool uses the network interface statistics provided by the kernel as an information source. This means that vnStat won’t actually be sniffing any traffic and also ensures light use of system resources regardless of network traffic rate.
To install this tool on Debian/ Ubuntu use –
sudo apt install vnstat -y
if you are using RHEL/CentOS then use –
sudo yum install vbstat -y
Once it gets installed use the given command to run this tool.
sudo vnstat -l
This will produce output something like given in the image below.

Graphical network monitoring tools on Linux
The given are some graphical network monitoring tools that provide full monitoring solutions for a system. You can monitor the system resources as well as network traffic on the system.
Nagios
Nagios core which was formerly known as Nagios is free and open-source monitoring software that can monitor systems, networks, and infrastructure. It has a web-based graphical interface Nagios provides full monitoring and altering services for servers, switches, and other applications.
There is paid and supported version is also available. You can download Nagios from its official website.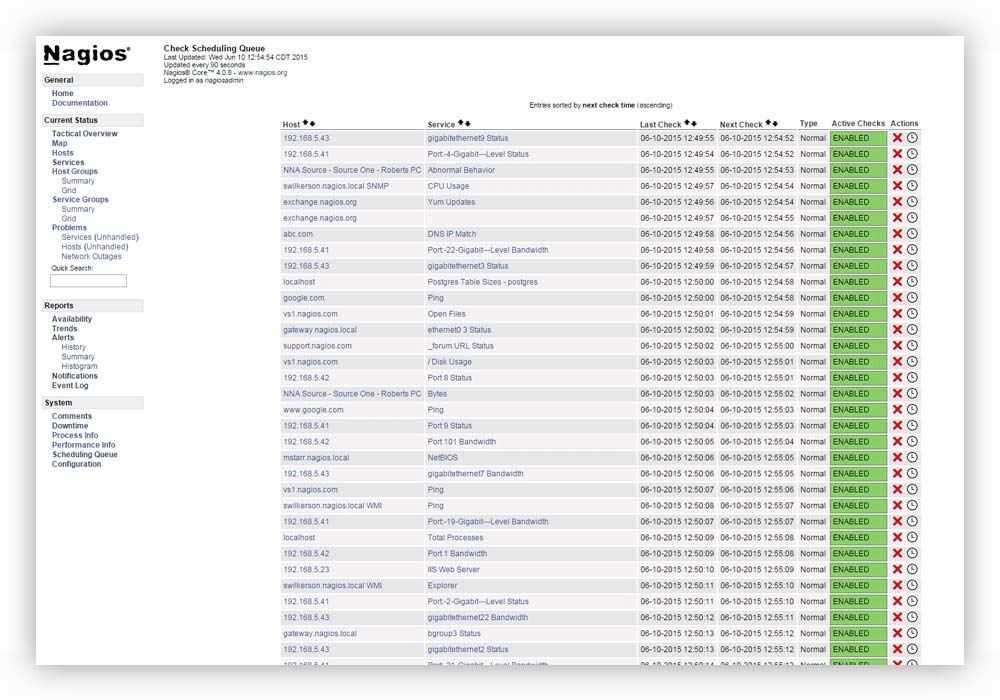
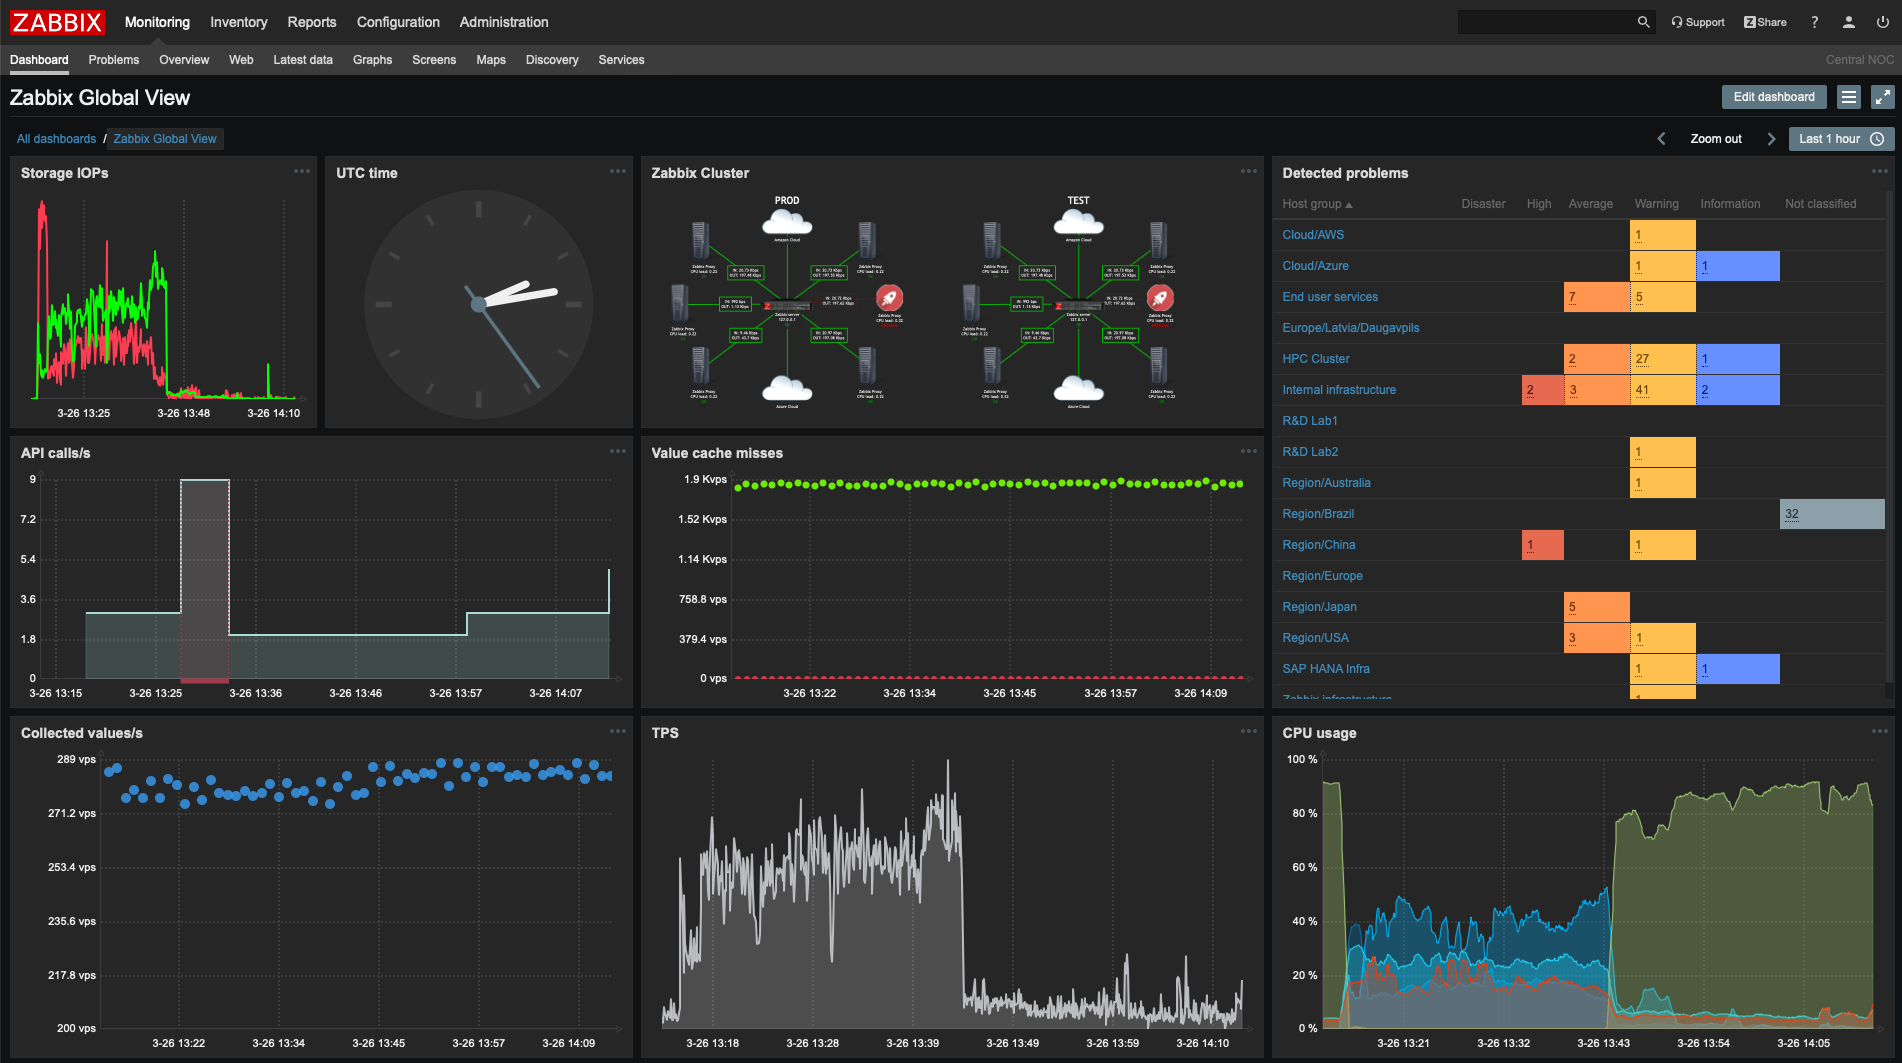
Zabbix
Like Nagios, Zabbix is also an open-source monitoring software. You can use it to monitor network utilization and performance, CPU loads, and memory consumptions of servers. This is a cross-platform application you can monitor operations on Linux, Windows (possible through agents), macOS, etc.
You can download Zabbix from its official website.
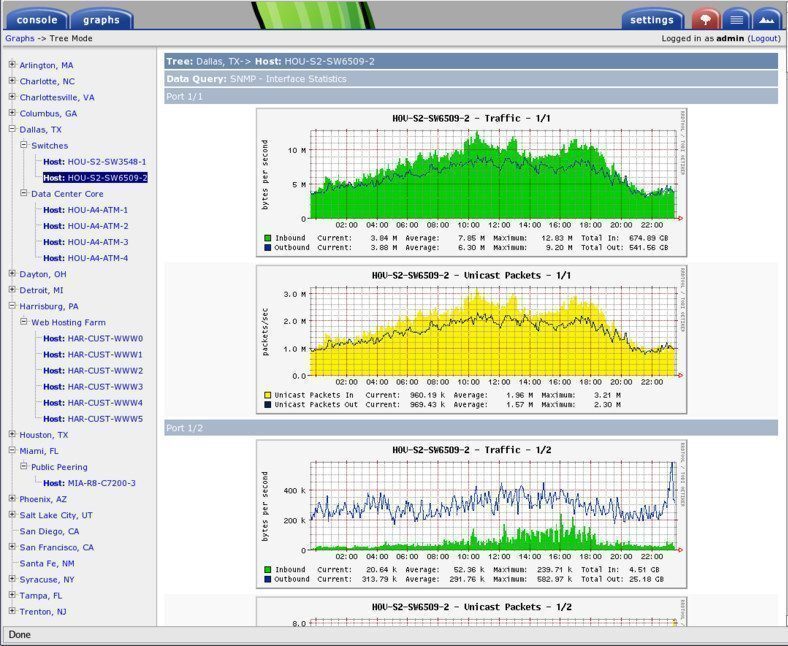
Cacti
Cacti is an open-source web-based monitoring tool that is a frontend of industry-standard data logging and graphing tool i.e. RRDtool. We can use this tool to monitor network traffic on a system.
You can download Cacti by visiting its official site.
Conclusion
There are lots of tools available for monitoring network traffic on a Linux system here we discussed a few of them you can try other tools also.
Now if you have a query then write us in the comments below.