The top is one of the most frequently used command in Unix like operating systems for the administrative tasks. It provides a dynamic and realtime view of the processes running in a system. You can compare it with the tasklist command or graphical task manager utility used in the Windows operating system. It also displays some other useful information such as used memory, CPU utilization, system uptime, etc.
In this article, we will discuss each information that is displayed as the output of the top command.
The information displayed by top command
Open your terminal and execute the following command –
top
Now you can see the output of this command in the below image –
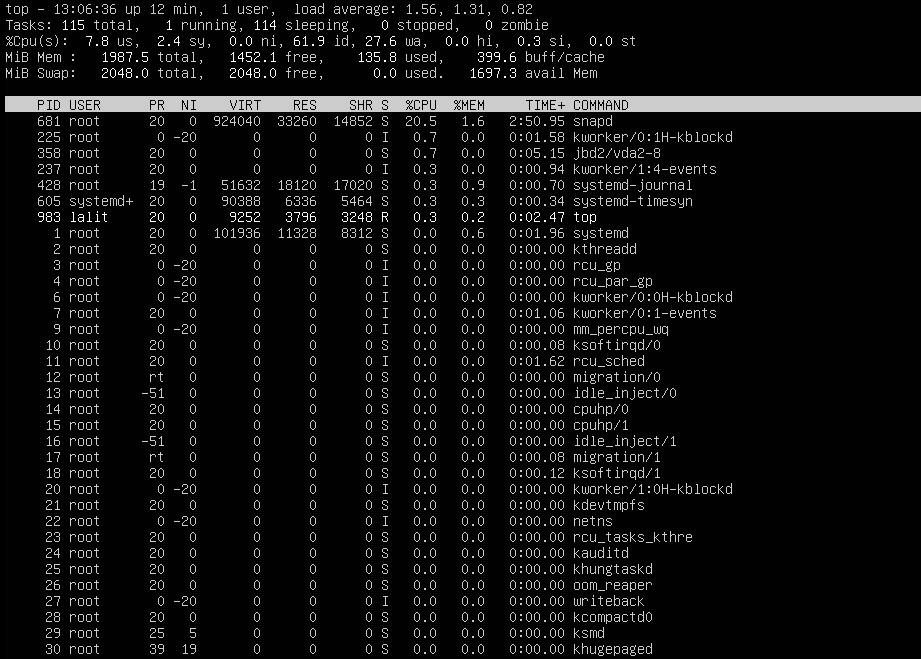
We can divide this output of the top command into two parts the first one is the above the white strip which contains the statistics of processes and resource usage we will call it upper half of the output. And the second is the remaining of the output which contains the list of running processes, we will call it the lower half portion of the output.
The details of the upper half of the output
As you can see the given image we are going to discuss the following part of the output –
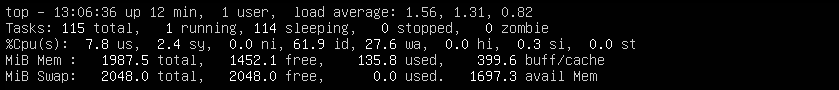
There are five rows in this we will discuss each one of them separately.
Row 1- top
See the image below this is the first row which gives the following information –
![]()
- 13:06:36 – is the current time
- up 12 min – is the system uptime
- 1 user – is currently logged into this system
- load average: 1.56, 1.31, 0.82 – is the average load of the system for the last 1 min, 5 min, and 15 min respectively
Row 2- Tasks
This row contains the statistics of the processes or tasks running in the system.
![]()
- 115 total – is the total number of processes running in the system
- 1 running – one process is running currently
- 114 sleeping – is the number of processes that are sleeping
- 0 stopped – zero processes are stopped
- 0 zombie – Processes terminated but parent process is unable to fetch their status immediately
Row 3 – % CPU
The third row contains information on CPU usages.
![]()
- 7.8 us – This is the percentage of CPU for user processes
- 2.4 sy – is the percentage of CPU for system processes
- 0.0 ni– The percentage of CPU used for the processes with priority upgrade using nice
- 61.9 id– The percentage of CPU not used
- 27.6 wa– Percentage of CPU for processes waiting for I/O operations
- 0.0 hi – The percentage of CPU serving for hardware interrupts
- 0.3 si – The percentage of CPU serving for software interrupts
- 0.0 st – “steal time”, is only relevant in virtualized environments. It represents the time when the real CPU was not available to the current virtual machine. It was “stolen” from that VM by the hypervisor for other tasks.
Row 4 & 5 – Memory (RAM) and swap space usage
![]()
The fourth and fifth rows display the information of RAM and swap space respectively. Swap space is the part of the hard disk which is used as the RAM when RAM gets nearly full. Now total, free and used have their usual meaning and –
avail mem – is the amount of memory that can be allocated to processes without causing more swapping.
buff/cache – Linux kernel tries to reduce the access time in various ways. It maintains a disk cache in the RAM where frequently used regions of the disk are stored. The disk writes are stored to a “disk buffer”, and the kernel eventually writes them out to the disk. The amount of memory used by them is the buff/cache value. The memory used by the cache is allocated to processes whenever needed.
The details of the lower half of the output
The lower half of the output shows a list of running processes with some other information as displayed in the image below –
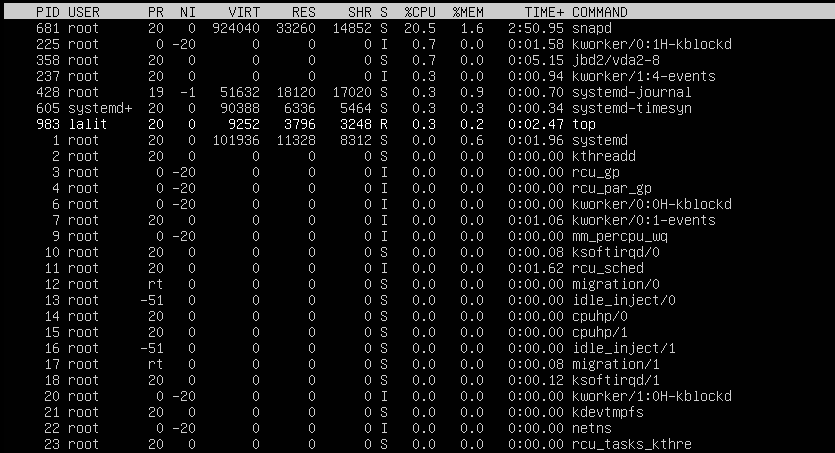
In this portion, information is organized in different columns that are –
PID – This column shows the process id of different processes (For example- snapd has a process id 681)
User – It shows the name of the user which owns the process ( For example – snapd is owned by root)
PR – This column shows scheduling priority of the process from the perspective of Linux kernel
NI – NI is the nice value which is a user-space concept. Its value should be -20<=NI<=19 (PR=20+NI)
VIRT– Virtual memory used by the process
RES– Physical memory (RAM) used by the process
SHR– Amount of memory with other processes
S– This indicates the status of a process
It can have the following values –
- S=sleeping
- R=Running
- Z=zombie
- T=Traced or stopped
- D= uninterrupted sleep
%CPU – The percentage of the CPU used by the process
%MEM– This is the percentage of the RAM used by the process
TIME+ -This is the total CPU time used by the process since it started
COMMAND– This column shows the name of processes
Conclusion
By reading this article you are now able to understand the usage of system resources in Linux or Unix. For usage of the top command, you can read top command usage with example in Linux or Unix.